Rich Dad Stock Blog
Free Information to Help You Build Wealth in the Stock Market
Category Archives: Sectors
Power Surge in Energy Stocks

Last week’s mention of the weakness in leading stocks like biotech prompted some insightful conversations in my recent Rich Dad® Education Trading Labs. Along with discussing potential adjustments to make in our trading we investigated which areas of the market may still be providing bullish opportunities. A brief survey of the major U.S. sectors found that energy stocks were sporting perhaps the most compelling setups.
Here’s a quick tip to save some time finding strong stock sectors. Rather than looking at the chart of each sector one after the other, use the sector rotation feature provided in the tools menu of the MachTrader software. After selecting “Tools”, hover your cursor over “Broad Markets” and a window will pop up that says “Sector Rotation: Sector SPDR PerfChart”.
When the interactive chart shows up change it to a histogram using the button on the bottom left (black arrow). Then, right click on the slider bar at the bottom right (blue arrow) and select “Past Week”. The standout in relative strength for the past week has been the energy sector besting the performance of the S&P 500 by 2.77% (red arrow).

The relative strength in the energy space is easily seen in the chart of the Energy Select Sector SPDR (XLE) which just broke out to a new multi-year high. Its recent consolidation has taken on the form of an inverted head and shoulders pattern provided further bullish implications for the budding sector.
 Source: MachTrader
With the broader market under pressure and many leading momentum stocks like Netflix (NFLX), Tesla (TSLA), Priceline (PCLN), and Solar City (SCTY) falling into downtrends, some may be wondering if they should even be considering new bullish trades at this juncture. The answer really depends on you. Some traders avoid entering any new bullish plays while the market is under pressure while others simply dial back both the amount and size of their bullish bets.
Here’s the key takeaway for me. Were I inclined to enter new bullish plays I would limit it to the best of setups in the areas of the market showing the most relative strength. If you’ve wondered where to look for stocks that are staying afloat amid the market’s recent swoon, wonder no longer. Take a gander at energy stocks.
Tyler Craig, CMT
Rich Dad® Education Elite Training Instructor
Biotech Bloodbath
Soaring Biotech stocks have soured this week. The beloved biotech sector – which I’m charting using the iShares Biotechnology ETF (IBB) – has been the champion of the ongoing bull market in U.S. stocks. The leadership in IBB really hit its stride in 2012 and hasn’t looked back since. Compared to the S&P 500’s 182% gain since March 2009, IBB is up a barn burning 368%. The bull market in biotech hit a snag this past month, though, and has now fallen some 15%.
So what do we make of the recent bloodletting? Is it a well-deserved bout of profit-taking or is a more ominous shift afoot?
I suspect it’s too early to tell. Let’s take a closer look on the recent damage suffered by IBB. Three bearish developments in particular stick out to me in IBB’s daily chart. First, the biotech ETF has fallen below its 50-day moving average for the first time in four months. Second, the downturn was accompanied by quite the volume spike. On closer inspection Monday’s volume of 6.5 million was the highest volume day in the ETF ever. Third, the swoon has been sufficient to reverse the short-term trend of the comparative relative strength.
 Source: MachTrader
Before declaring the bull run in biotech dead, however, allow me to mention a few counter-arguments. For starters, IBB has stumbled beneath its 50 MA numerous times in the past but successfully recovered from each downturn. Second, the weekly uptrend in IBB is well intact despite its recent plunge. The uptrend in relative strength also remains in place. If the selling frenzy is successful in turning these larger trends lower then traders should begin taking the weakness in biotech much more seriously.

The swiftness of the plunge in biotech is concerning to be sure. Traders hoping that the latest pullback in stocks will be short-lived should pay close attention to the action in IBB. If this once leading sector can begin to rise again it may well signal the broad market uptrend is ready to resume.
Tyler Craig, CMT
Rich Dad Education Elite Training Instructor
Sector Rotation – The Lifeblood of a Bull Market
Last Thursday marked the five year anniversary of the aging bull market for U.S. equities. Since the infamous “devil’s bottom” on March 6, 2009 the S&P 500 Index ($SPX) has climbed an impressive 181% from 666 to 1873. As with all bull markets, sector rotation has played an integral part in propelling stock prices to their now lofty heights.
Pro Tip: Sector rotation refers to the movement of money from one stock sector to another over time.
Sector rotation is what allows a broad index – like the S&P 500- to continue climbing day after day without experiencing a major downturn. Here’s how it works. Let’s say the consumer discretionary sector is leading the market but becomes a bit overbought and in need of some type of correction. For the next few weeks this profit-taking may takedown the sector a notch or two. At the same time suppose money flows into a previously lagging sector like financials making it the new leader. The net effect of this rotation prevents the pullback in consumer discretionary stocks from dragging down the entire market.
As long as we see money flow into a weak sector when a strong sector gets hit the broader market should stay afloat. It’s when we see money come out of all sectors en masse that you should start to worry.
The other dynamic to consider is the tendency for a bull market to eventually rise all boats. Though a particular sector like energy or technology may drop for a spell, the weakness won’t persist if the bull market remains on track. Eventually the optimism will spill into these underperformers and lift them higher.
We’ve seen just such a shift in the financial sector this week. As shown in the chart below the financial sector (XLF) lagged the rest of the market for the first two months of 2014. Since the beginning of March, however, money has flooded into this area making it the new leader.
 Source: MachTrader
Here’s the bottom line. Don’t count out lagging sectors. Provided the broader bull market persists, money will eventually rotate back into these areas as. Use the Comparative Relative Strength study (CRS) to identify when they start leading again.
Tyler Craig, CMT
Rich Dad Education Elite Training Instructor
It’s a Financial Resurrection!
The bull market in stocks returned with a vengeance this week with the financial sector leading the charge. After falling on fears over the looming debt ceiling, traders snatched-up stocks with abandon in anticipation and response to the deal struck in D.C. The October dip proved to be yet another in a long line of buying opportunities.
Sector rotation was in full force amid the recovery as the recently beaten down financial sector finally overcame its bout of under-performance. Since peaking in July the XLF spent the next two and a half months lagging the broader market. Spectators who have been waiting for financials to resume their leadership role will be happy to know XLF was the best performing sector over the past week.
The evolution of relative performance for financials, or any sector for that matter, is easily seen in the indispensable Comparative Relative Strength (CRS) indicator. When the stock in question is exhibiting relative strength versus the S&P 500 the CRS line rises, when the stock is exhibiting relative weakness the CRS line falls.
Since the CRS line is often erratic, using trend lines can help with discovering the overall trend. Take note of the accompanying chart of XLF with accompanying CRS study. I’ve drawn a few trend lines to identify its recent transition from leader to laggard and back again to leader.
 Source: MachTrader
The recent break of the downtrendline in the CRS panel suggests the regime of weakness in XLF may be ending. Time will tell whether or not the outperformance continues, but one thing is for sure – if you’ve been avoiding financial stocks because of their weak sauce performance, you needn’t shun them any longer.
Consider this just one of many positive developments in the stock market this week.
Tyler Craig, CMT
Rich Dad Education Elite Training Instructor
How to Turn One Trade Idea into Four
Suppose you have identified a stock providing a high quality bullish setup. Whether you discovered it in your existing watchlist, a TradeSeeker scan, or elsewhere matters not. With a few simple steps you can often turn this one profit opportunity into multiple potential money makers.
Many stocks move in sympathy with other companies residing in the same industry. If a stock like Intel (INTC) reports great earnings it often boosts the entire semiconductor space. If Fedex (FDX) warns of a slowdown in their business, shares of United Parcel Service (UPS) are likely to take a hit as well. We can exploit this correlation between similar stocks when searching for trade ideas. Here’s an example:
This week in one of our Trading Labs we discovered a classic bull retracement setup in Borgwarner (BWA). Now, I’m fairly well versed in the language of ticker symbols but must admit BWA is not a company I was familiar with.

Rather than simply jumping in BWA willy-nilly, however, we decided to do a bit of digging to see if some of its competitors might also be providing nice uptrends with potential buying opportunities. We selected the “Fundamental” button atop the MachTrader to open up the fundamental data window. Within the first page that popped up we discovered BWA was in the Consumer Cyclical sector and in the Auto and Truck parts industry.
 Next, we visited the second page of the Fundamental Data Window by clicking on “Company Comparison” at the top of the window. On the right hand side of the page it displayed “Companies from the same Industry Ranked by Highest Sales.”
Jackpot!
These six extra stocks – Denso Corp (DNZOY), Johnson Controls (JCI), Magna Intl. (MGA), TRW Automotive (TRW), Delphi Automotive (DLPH), and Lear Corp. (LEA) have a good chance of looking like BWA which means there may be some other trades to be had.
 Now, if after assessing these alternate opportunities we find that BWA still has the best setup, then the entire exercise helped bolster our resolve that BWA boasts the best setup in the industry and we can now trade it with added confidence.
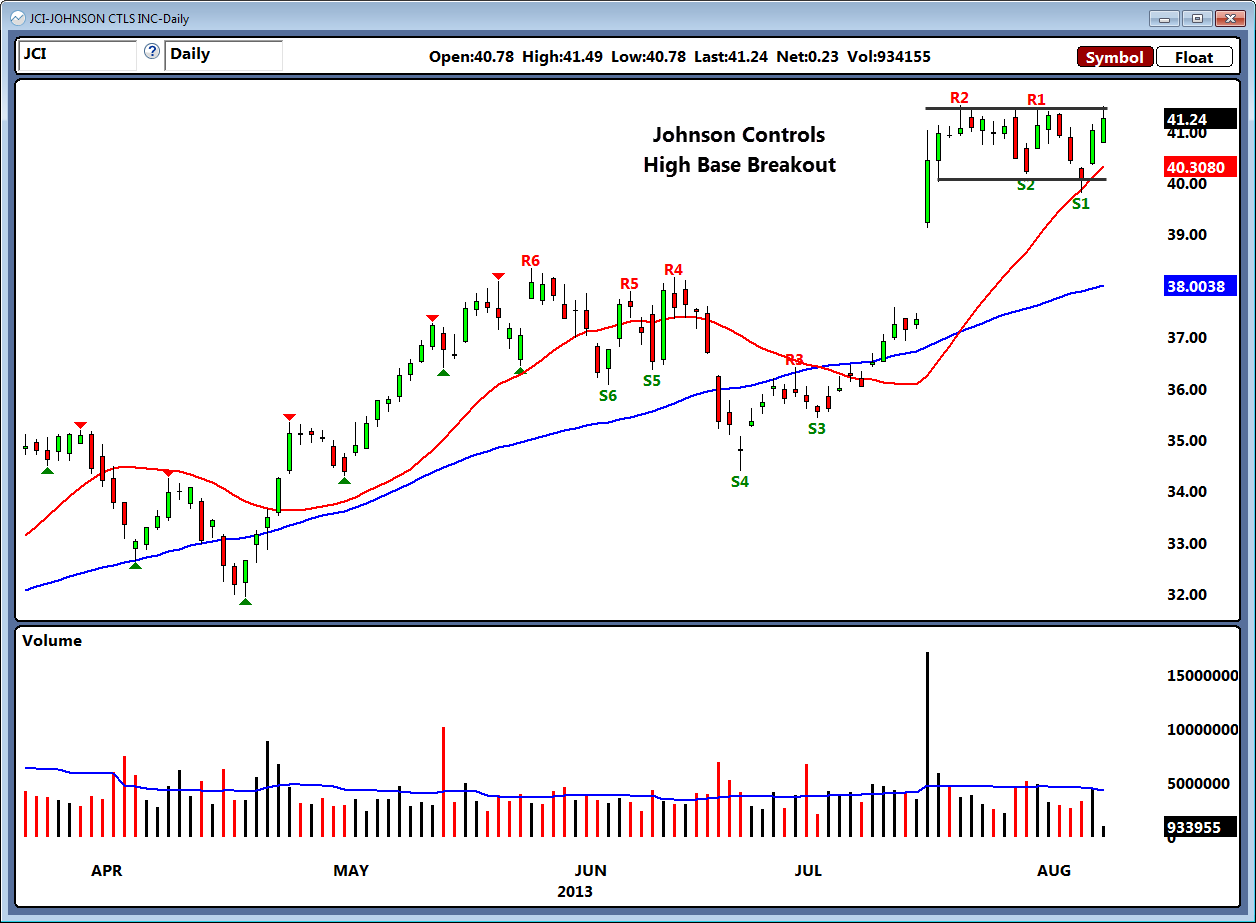
In this instance there were actually a few other alluring setups in the group. One example, shown below, is JCI which has been forming a nice high base since its large earnings gap last month.
 This is just one of the many ways the MachTrader software can aid in the trade discovery process. Come join us for one of our free demos where we provide daily overviews of how to make the most of the platform.
Tyler Craig, CMT
Rich Dad Education Elite Training Instructor
