Rich Dad Stock Blog
Free Information to Help You Build Wealth in the Stock Market
Tag Archives: wall street
The Irrationality of Rationality
The Irrationality of Rationality
The headlines scream about the government shutdown and debt ceilings as both political parties attempt to create a daily spin on why the opposing party is to blame. On Monday, negative headlines can create huge waves of panic and the market can fall hundreds of points. On Tuesday, positive headlines can create euphoria as disaster appears to be avoided. The market responds by going up hundreds of points. The news that accompanies these headlines has significance to forward thinkers who attempt to see the larger picture, and analyze and determine where the market and economy are heading. However, too many traders attempt to make sense of the news and apply its significance to their day-to-day trading. When traders attempt to rationally determine the actions of an irrational market, they often get burned in the process.
Imagine a person running naked, wildly down the street, waving their arms as they scream at the top of their lungs. While you might have some fascination and wonder why the person is behaving in such a manner, would you place a monetary wager in guessing in which direction they were going to head next? Sure, you might see a pattern where the person runs north 100 yards, and then south for 50 yards, but are you really surprised when the person abruptly turns east or west? Are you shocked if the person suddenly sits down and starts worshiping the elm tree that is in someone’s yard?
Make no mistake, the market oftentimes behaves like a crazy naked person running down the street. At best, it behaves like a drunk at the bar who is giddy one night only to be found crying in the corner the next. A “rational” person would never take the time to analyze these actions and invest money in their probable outcome. However, that is just what many traders do in their attempt to rationally analyze the news in relation to their day-to-day trading. They assume that the market is not in fact a crazy, emotional creature and then deductively attempt to determine how the given news is going to impact the market in the coming days. They then place trades based on how they think the market is going to rationally behave. In their attempts to be rational, they in turn exhibit irrationality.
News That Matters
A young trader spoke with his trading mentor each day before the market opened. Each morning they would talk about the market and the stocks the young apprentice was following, and the mentor would dispense whatever wisdom he felt necessary that day. One day, the young trader showed up eager to talk about a dramatic news event that was occurring. After hearing the young trader talk, the mentor looked at the chart of stock he was following, saw that the stock had fallen in price and said, “This news does not matter to me.”
The next day, the news event continued to occur with the young trader convinced that he had determined the fate of the short-term price movement of the stock. The young trader showed up and relayed his analysis to the mentor. The mentor listened, looked at the stock’s chart, saw that it had dramatically fallen in price and said, “This news does not matter to me.” The following day the news story continued, with the new trader pleading his case that he was correct in his analysis as the stock was falling further, frustrated that the mentor had not acted on the news earlier. The mentor heard the young trader’s case, looked at the stock chart and saw that the price of the stock was falling below key levels of support. The mentor took out his pen and pointed at the price falling through the level of support and said, “Now I’m interested.”
It is very easy for new traders and undisciplined traders with experience to get caught up in the news of the day. It is tempting for traders to place trades based on the direction they think the market is heading. Unfortunately for these traders, most news simply sends the stocks they are following up and down between levels of support and resistance. Good news might seem to propel a stock up until it hits a level of resistance. Bad news might make it seem that a stock is ready for a new downward trend until it hits a solid level of previous support.
When news truly matters it will break these levels of resistance or support. This can mark the beginning of a new downtrend or uptrend and it has great significance to those that trade based on technical analysis. If a stock had solid support at the $50 price range and news sent it falling below that area, you should take notice. It is an event that you can profit from by placing highly probable trades. Of course, you don’t need to be following the news or guessing its significance to profit from these situations. Simply follow your charts and adhere to your technical analysis and you eliminate all of the guesswork.
On the television show Battlestar Galactica there was a famous line that related to the major story line, “All of this has happened before and will happen again.” It is very easy to get caught up in the headlines of today and try and make sense of them in regards to your trading. Those that have been trading for decades realize that whatever news event is occurring now has happened before, and undoubtedly will happen again. The news may not be identical in nature but the effects certainly are: hope or fear will be created, and the market will appear to be reacting to that news.
If you want to succeed in the trading game then you need to separate yourself from these emotions. Do not attempt to determine how the market is going to rationally react to any given news. Let your knowledge of charting and technical analysis dictate your actions and you will profit on news that truly has significance.
The Inescapable Betting Nature of Trading
The one common theme tying traders of all stripes together is that of betting. Regardless of the strategy or time frame selected we’re all placing bets of a sort. The outcome we’re banking on either happens or it doesn’t. Simple as that. Some erroneously believe by venturing into more complex strategies – particularly in the options market – they will somehow bypass betting, or avoid taking any risk. Sadly, ’tis not so. The betting nature of trading is inescapable.
A simple trader may purchase a stock they reason is poised to rise in value. They are placing a bet the stock will rise. It either will or it won’t.
A slightly more sophisticated trader may sell an out-of-the-money call vertical spread on a stock they reason is poised to meander sideways or grind lower. They are placing a bet the stock won’t rise much in value. It either will or it won’t.
An advanced trader may gamma scalp long straddles in an attempt to capture the difference between the implied volatility priced into the options and subsequent volatility realized by the underlying. They are placing a bet the options are under-priced. Either they are or they aren’t.
Since earnings season is upon us, straddles and other types of bi-directional, volatility strategies are sure to capture the attention of many traders. Trading straddles into earnings has no more an assured outcome than buying stocks.
If you’re participating in a perpetual search for assured outcomes as you hop from one strategy to another, allow me to save you some time. They don’t exist.
Your edge lies largely in your ability to identify market conditions favorable to your approach and exploit them, avoid unfavorable conditions, and manage risk.
Tyler Craig, CMT
Rich Dad Education Elite Trainer
Learn more about our Elite Stock Courses here.
It’s a Financial Resurrection!
The bull market in stocks returned with a vengeance this week with the financial sector leading the charge. After falling on fears over the looming debt ceiling, traders snatched-up stocks with abandon in anticipation and response to the deal struck in D.C. The October dip proved to be yet another in a long line of buying opportunities.
Sector rotation was in full force amid the recovery as the recently beaten down financial sector finally overcame its bout of under-performance. Since peaking in July the XLF spent the next two and a half months lagging the broader market. Spectators who have been waiting for financials to resume their leadership role will be happy to know XLF was the best performing sector over the past week.
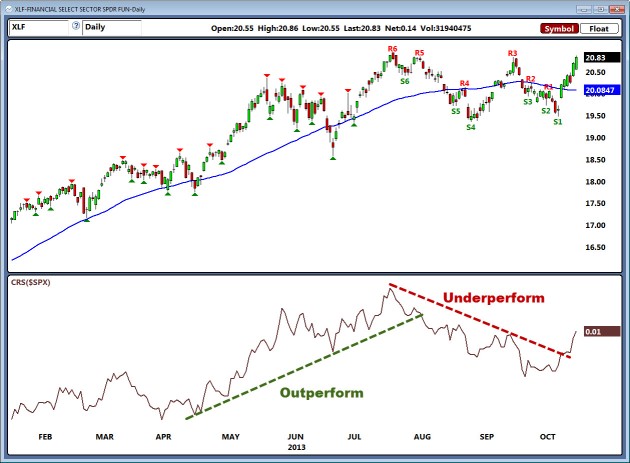
The evolution of relative performance for financials, or any sector for that matter, is easily seen in the indispensable Comparative Relative Strength (CRS) indicator. When the stock in question is exhibiting relative strength versus the S&P 500 the CRS line rises, when the stock is exhibiting relative weakness the CRS line falls.
Since the CRS line is often erratic, using trend lines can help with discovering the overall trend. Take note of the accompanying chart of XLF with accompanying CRS study. I’ve drawn a few trend lines to identify its recent transition from leader to laggard and back again to leader.
The recent break of the downtrendline in the CRS panel suggests the regime of weakness in XLF may be ending. Time will tell whether or not the outperformance continues, but one thing is for sure – if you’ve been avoiding financial stocks because of their weak sauce performance, you needn’t shun them any longer.
Consider this just one of many positive developments in the stock market this week.
Tyler Craig, CMT
Rich Dad Education Elite Training Instructor
Market Bifurcation and Two Lab Trades
Market Bifurcation
As Wall Street continues to grapple with the government shutdown, a notable divergence is developing in the broad indexes. While the Dow Jones Industrial Average ($INDU) and S&P 500 ($SPX) Indexes have tumbled beneath their 50-day moving averages, the Russell 2000 ($RUT) and Nasdaq Composite ($COMPQ) Indexes have remained stalwart sitting atop their 20-day moving averages.
So what’s the theme?
Large-caps are lagging and small-caps (as well as more volatile tech stocks) are leading. And that’s a good thing. Due to the higher risk associated with small caps and tech they usually lead when investors are optimistic and risk appetite is on the rise. So long as these guys continue to exhibit relative strength investors shouldn’t get overly fearful over the shenanigans in Washington.
In our weekly trading labs we review a number of practice trades to help illustrate how to apply the concepts and strategies taught in our Elite Training classes. Let’s take a look at two recent trades and see how they’ve held up during the recent market sell-off.
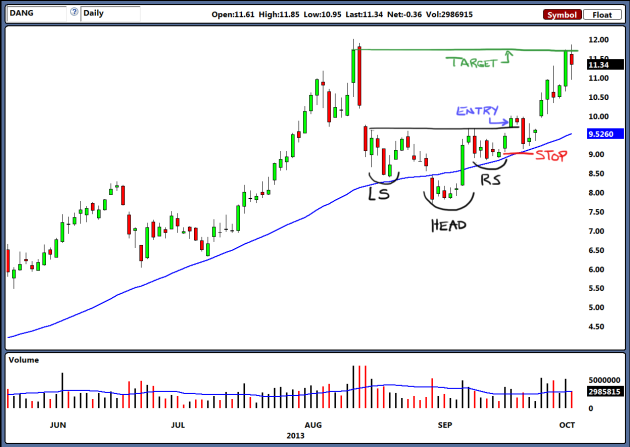
First, we have a simple stock trade on DANG that we discussed in one of my recent Introductory Trading Labs. After identifying the potential inverted head and shoulders pattern, we bought the stock at $9.70 on Sep 19th. The stop loss was placed below the prior day’s low around $9.05 giving us $0.65 of risk. For the profit target we used the next resistance level near $11.70 giving us a potential reward of $2.00. That’s an impressive 3 to 1 reward to risk ratio. Though the stock dropped for a few days after we entered, it eventually powered higher finally tagging the target yesterday.
 Source: MachTrader
This is a great example of a small cap stock that completely ignored the pullback in the broader market.
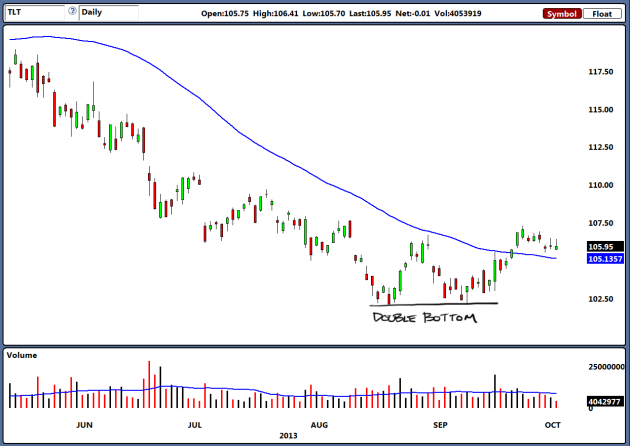
The second trade is one recently entered in my Intermediate Lab on Wednesday that focuses on options and basic spread trades. The recent downtrend in bond prices appears to have carved out a textbook double bottom. As shown in the accompanying chart of TLT – a popular U.S. Treasury bond ETF – prices have ascended back above the 50-day moving average (blue line) for the first time since May. To exploit neutral to bullish price action in TLT over the next month we sold a November 102-98 bull put spread for $0.65 credit.
 Source: MachTrader
The bullish trade on TLT should benefit if continued angst over D.C. drives scared money into the perceived safety of bonds.
These are just a couple examples of the types virtual trade examples we highlight in our weekly market discussions.
Tyler Craig, CMT
Rich Dad Education Elite Trainer
Learn more about our Elite Stock Courses here.


